Issue #2 | Process Development and Control in Metal Additive Manufacturing
Click to read Issue #1 of this blog series > Issue #1: Process Development and Control in Metal Additive Manufacturing
Click to read Issue #3 of this blog series > Issue #3.1: Process Development and Control in Metal Additive Manufacturing
By: George Baggs
George is a Systems Engineer at Moog Inc., working in the Space and Defense Group at Moog’s East Aurora, NY location
THE SCIENTIFIC METHOD
Experimentation is a fundamental component of the scientific method, because it closes the theory-data cycle. In the Deming PDSA (Plan, Do, Study, Act) cycle, experimentation is part of Plan, Do and Study; in terms of Six Sigma DMAIC (Define, Measure, Analyze, Improve, Control), experimentation belongs with Define, Measure and Analyze.
INDUSTRIAL EXPERIMENTATION
Within an industrial setting, the need to minimze the expenditure of experimental resources is constantly being balanced against the risk of obtaining poor or inconclusive data. In a setting where the underlying aim is to gather and study data as quickly and cost-effectively as possible, DOE (Design of Exeriments) offers an extremely efficient method of experimentation.
For complex processes such as Laser Powder Bed Fusion (LPBF) used in Moog’s Additive Manufacturing Center (AMC), the use of DOE has allowed us to quickly map and understand the process design space, and then act to improve and control the process effectively and efficiently. As our level of knowledge has grown, the limitations and opportunities presented by LPBF have also become more apparent.
To provide some context, a simple set of DOE examples are visualized and explained below.
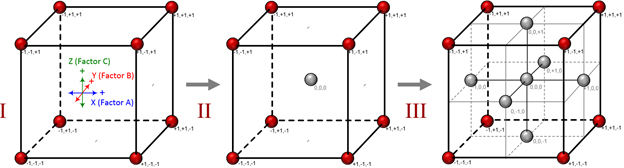
Cube Representations of a Set of Three-Factor DOE Matrices
The images above visually illustrate how three factors for study can be arranged into DOE matrices as depicted by cubes in 3-dimensional XYZ Cartesian space, where each experimental factor (A, B and C) is represented by one of the coordinate axes, the two-factor interactions (AB, AC and BC) are represented by each coordinate plane, and the three-factor interaction (ABC) is represented by the cube volume:
• Matrix I is a full-factorial DOE with 3-factors at 2-levels yielding 8 different treatment combinations (shown as the red corner points); with just 2 levels per factor, only the linear effects can be estimated. This matrix is termed a full-factorial design because the components of variation resulting from the 3 main effects, the 3 two-factor interactions, and the single three-factor interaction, can be separated in the analysis. The figure below shows this matrix mathematically arranged in Yates[1] order.

• Matrix II shows a center point (grey) added to Matrix I, so that the presence of curvature may be detected; however, the specific source or sources of curvature cannot be ascertained because the component or components of variation from quadratic effects will be pooled with the effects from all 3 factors.
• Matrix III shows six face-centered star points (grey) added to Matrix II to create a Response-Surface Methodology[2] (RSM) DOE called a Central-Composite Design (CCD). The star points will allow the sources of curvature to be better estimated, and since the star points are centered on the faces of the cube, the matrix shown is termed a CCF (Central-Composite Face-centered) RSM, where the star point distances from the center point are ±1 (a normalized unit of the factor level settings termed alpha or alpha). For the CCF |alpha| = 1.0, and depending on the number of factors studied and the experimental strategy, the value of a is modified to change characteristics of the RSM. Note that the CCF is not a full-factorial matrix, because star points are shared with the two associated factors in the cube face planes.
[1] Frank Yates was a 20th-Century pioneer of statistics
[2] The CCD (Central Composite Design) is one of many different response-surface method designs that can be used for process optimization; the experimental output is studied as an n-dimensional response-surface optimization problem. These types of experimental matrices were introduced by statisticians George E.P. Box and K. B. Wilson in the early 1950s.
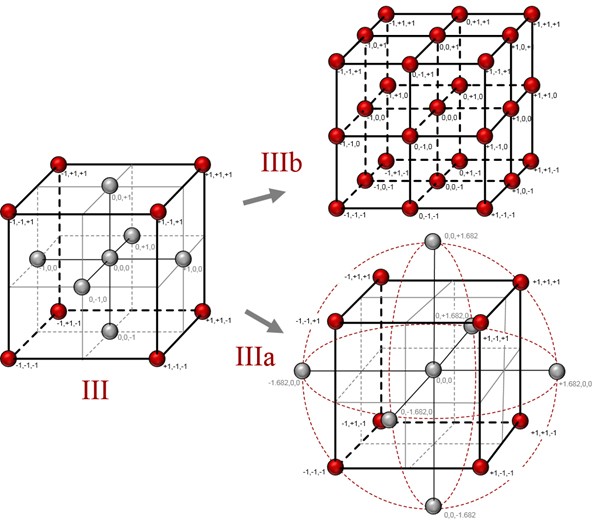
• Matrix IIIa shows the Matrix III star points extended outward to create a Central-Composite Circumscribed (CCC) RSM, with alpha = 1.682 that allows the matrix to be rotated[3] around the center point in any orientation (each corner and star point are on the surface of a sphere); conversely, if extending the factor extremes is not desirable or perhaps impossible (i.e. to prevent exceeding a process safe limit), the red corner factor points can be made into the star points and the factor levels contracted by the reciprocal of 1.682, creating a Central-Composite Inscribed (CCI) RSM. To map the response surface using sequential experimentation, the RSM CCD can be moved over the process space by extending the matrix in any direction and reusing part of the existing data for each move. Even during production, many small moves can be made sequentially using a method called EVOP (Evolutionary Operations).
• Matrix IIIb shows a full-factorial 3-level version of Matrix III, which adds a zero level for all 3 factors. This full-factorial matrix has 27-treatment combinations (red points) to estimate the quadratic response for all factor main and interaction effects. This matrix design is based on the Taguchi L27 Orthogonal Array[4], which can be fractionalized and used to study as many as 7 different 3-level factors by assigning additional factors using the information space for the two and three-factor interactions[5].
DOEs often have many additional factors beyond 3, and this would be represented by n-dimensional space (something that is not easily illustrated). Often the experimental matrix is fractionalized, essentially by under-sampling the design space as described for the L27 example above, in order to increase the number of factors under study while retaining the same number of experimental runs. Typically, the main effects are intentionally confounded with 3-factor and higher interactions because the possibility for the actual occurrence of these higher-order interactions is low; this can be enhanced by the application of engineering theory beforehand, or the results from prior experimentation, to determine the likelihood of an interaction. As described in the previous blog sidebar, the properties of orthogonality and balance are often sacrificed to enhance other aspects of the information space, or to satisfy different experimental constraints. In more extreme cases, there are classes of experiments termed super-saturated, that have more experimental factors then runs. The alias structure of the main effects and interactions must be fully understood to safely use any type of fractionalized approach, and as always, the reduction of experimental resources must be weighed against the risk of generating poor or inconclusive data.
Experimental Strategy
Establishing a good AM (Additive Manufacturing) process involves a systematic and disciplined approach for each phase of process development leading to production, and rigorous documentation of the experimental results and analysis findings.
[3] A rotatable CCD matrix design with proper weighting between the cube and star points can minimize the normalized average integrated prediction variance, and will therefore exhibit the desirable property of I-optimality.
[4] Part of the Robust Design Method created by Japanese engineer Dr. Genichi Taguchi in the 1980s
[5] Factionalizing the matrix can be tricky since the 3-level main and factor-interaction effects can become highly confounded in a very complex fashion; therefore, care must be taken when adding additional variables above 3
Experimental Design (and/or Process) Strategies
| Design Approach |
Process Phase |
Comments |
| Screening |
Modeling / Development |
Exploration of the experimental space |
|
| Parameter |
Development |
Identification of significant factors |
| Tolerance |
Development / Production |
Optimize factors, Establish Cp (process capability) |
| EVOP or Simplex optimization |
Production |
Maximize yields (Evolutionary Operations) |
| SPC |
Production (post-DOE) |
Monitor the process developed through DOE (statistical Process Control)6 |
At Moog, we have discovered that the fundamental capability of the technology within the current crop of LPBF AM machines is at point where we have not yet moved into the tolerance-design phase of process development. Although improvements are being introduced (unlike subtractive manufacturing technology) LPBF AM technology has not matured sufficiently for tight tolerance optimization and EVOP. The AM process can therefore be described as high-energy, which is a process that requires much oversight and external control to ensure the production of good parts. Moog is working with both the AM raw material suppliers and AM machine design houses to address our findings, most of which have been rigorously quantified through empirical studies such as DOE.
AM INFLUENCES ON DOE APPROACH
LPBF AM presents several unique challenges for controlling error within the DOE. Because parts are physically fabricated upon a build plate within the AM machine, the DOE factors must be partitioned into within-build-plate (WBP) and between-build-plate (BBP) parameters. WBP parameters are variables that are primarily confounded spatially[7] with process noise effects, while BBP parameters are variables that are primarily confounded temporally with process noise effects. WBP experimental treatment combinations are spatially randomized, while BPP parameters are typically blocked (experimentally) with factors that are difficult to change or are nuisance factors. The table below shows some of the error-control methods that can be used to improve the experimental results.
[6] SPC can be put into place if the special-cause (non-random) variation has been eliminated from the process.
[7] Because a build plate is not fabricated instantaneously, there are also temporal noise effects that can influence WBP parameters, but these tend to be minor compared to the effects of noise in the spatial domain.
DOE Error Control Strategies
| Error Control Approach |
Description |
Comments |
| MSA |
Measurement System Accuracy (pre-DOE) |
Understand the aleatory and epistemic uncertainties within both the process measurements, and the DOE output response measurements
|
|
| MCA |
Machine Capability Analysis (pre-DOE)
|
Understand AM machine variation (lack of capability) and the effects of the associated aleatory and epistemic uncertainties upon DOE factor settings
|
Randomization
|
For both the DOE WBB and…where possible BBP treatment combination orders
|
Account for the possibility that unknown spatial and temporal variables will produce bias in the DOE output response data-vector
|
Replication
|
Partial or complete duplication of DOE treatments combinations
|
Quantify the amount of pure error existing within the experiment
|
Blocking
|
Primarily on BBP factors, but also can be applied to known WBP temporal factors
|
Segregate and account for already known, but difficult to change/randomize and/or nuisance effects
|
Validation
|
Post-experiment (post-DOE)
|
Validate experimental findings
|
Verification
|
Post-validation
|
Verify that a process is ready for production
|
AM MACHINE COMMISSIONING
Process characterization and optimization through DOE is a standard method routinely used in the Moog AMC when commissioning an AM machine, validating an AM process or developing a new AM process.
This rigor is documented in formal process operating procedures and the results are maintained as Moog engineering test reports.
Additional Resources:
PennState, Eberly College of Science, STAT 503, The Basic Principles of DOE
NIST (National Institute of Standards and Technology) / Sematech Engineering Statistics Handbook
National Academies Press, Statistical Methods for Testing and Evaluating Defense Systems
Wu, Jeff C.F., and Hamada, Michael S, Experiments: Planning, Analysis, and Optimization, 2009 2nd Ed
Kinyuna, Margaret, et al., I-optimal Rotatable Central Composite Designs, Imperial Journal of Interdisciplinary Research (IJIR), Vol2, Issue-10, 2016
Share this Article: