Additive Manufacturing Machine and Measurement Capability Limitations (Part 1 of 2)
In the previous issue, several methods of DOE (Design of Experiment) error-control used at Moog were touched upon briefly. This issue will superficially explore the effects of the additive manufacturing (AM) machine process capability and measurement system accuracy (MSA), upon the Laser Powder Bed Fusion (LPBF) process.
I have decided to break this issue into two parts:
• Part One (this article) discusses the general effects of machine capability and MSA upon the AM LPBF process at Moog.
• Part Two (Issue #3.2) is a sidebar about modeling the machine capability within a computer simulation of the LPBF specific energy density using DOE, and comparing this approach to the more traditional methods that use Monte Carlo and Sensitivity analysis.
DOE Error-Control Strategies
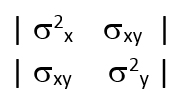
Whenever conducting a DOE, a proper error-control strategy (sometimes called the ‘Error Control Design’) is also very important. Some of these strategies are intrinsic to the experiment, such as randomization, replication and blocking, while others such as MSA and MCA (Machine Capability Assessment) are part of the profound knowledge of the uncertainties existing within the overall system. MSA and MCA are summarized in the table below.
VARIATION AND UNCERTAINTY
Assuming a process output Y correlates with a process input X, variation within that process input parameter (e.g. MCA error) will be transmitted to the process output. Additional, error at the process output (e.g. MSA error) will be superimposed upon the transmitted process variation, and this will increase the observed variation in the process output.
The MSA and MCA variation sources will increase overall process uncertainty, degrading the quality[2] of the process output, and depending on process maturity and knowledge, the uncertainty is a mixture of both aleatory and epistemic types; this information is important for proper experimental error-control.
- This uncertainty will manifest as residual error (aka unassigned variation) in the analysis of the experimental results.
- The factor settings in any DOE, as well as the associated response measurements, will have stochastic components from the capabilities of setting experimental factor levels, as well as making the experimental response measurements.
- With adequate profound knowledge, the experimental effects from MSA and MCA errors can be mitigated by providing greater separation between the factor levels, and/or with more experimental replications to exploit central tendency.
MCA IN THE MOOG AMC
The histogram in Figure 2 below shows the negative effect from less-than-ideal machine capability on achieving a targeted specific Energy Density (Ed) of 100 J/mm3 within the metal powder during LPBF.
The histogram represents effects from multiple sources of MCA error3 upon the Ed of the LPBF AM process. The Ed metric is a process indicator for LPBF4. There are published equations (Reference[1], Reference[2]) that allow a coarse lumped-element model of Ed to be made, which at Moog, we have refined into a more detailed version5 to account for effects from the machine optics and other settings that are specific to our AM machines; MCA studies have been conducted to determine the errors in the AM machine settings, and this information is used in computer Monte Carlo simulations (MC) to estimate the contribution of machine capability to process error. With normally-varied inputs, the histogram shown above indicates that the Ed can vary from the targeted setting by approximately ±9%.
References:
[3] For the purposes of this writing, the variation used in the various process inputs for the Ed model reflects only the MCA component of error, which we separate from measurement error with gauge capability studies; additionally, there is no measurement error in the Ed response because it is a computer model; note that there are advanced methods for modeling the propagation of uncertainty through complex processes and designs (see the 3rd bullet, under the ‘Additional Resources’ section at the end of this write-up)
[4] The complex relationship between Ed and the quality of the process output is non-linear and highly non-monotonic
[5] There are also ongoing efforts to perfect advanced physics-based ICME (Integrated Computational Materials Engineering) models
 with Added Variation at the Y Output from Measurement Uncertainty (right panel)") Fig. 1: The Transmission of Variation from X Input to Y Output (left panel) with Added Variation at the Y Output from Measurement Uncertainty (right panel)
Fig. 1: The Transmission of Variation from X Input to Y Output (left panel) with Added Variation at the Y Output from Measurement Uncertainty (right panel)
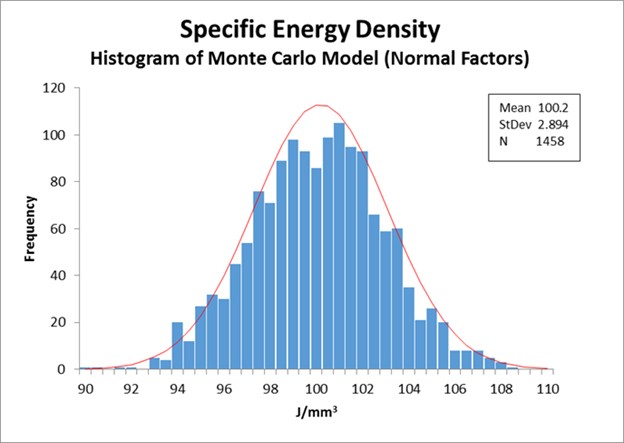 Fig. 2: AM Process Monte Carlo Simulation Model Output